Null Distribution: Family of 5
Figure 3.4 The null distribution for the number of girls in a family of 5 children, built from 100,000 simulated families under a fair coin-flip model (P(girl) = 0.5). Families with 4 or 5 girls — the more surprising outcomes — are shaded darker.
Every notebook here is yours to modify — swap in your own colors, styling, and data, and use it as a starting point for your own publication-quality graphics.
▶ Run interactively in browser ↗
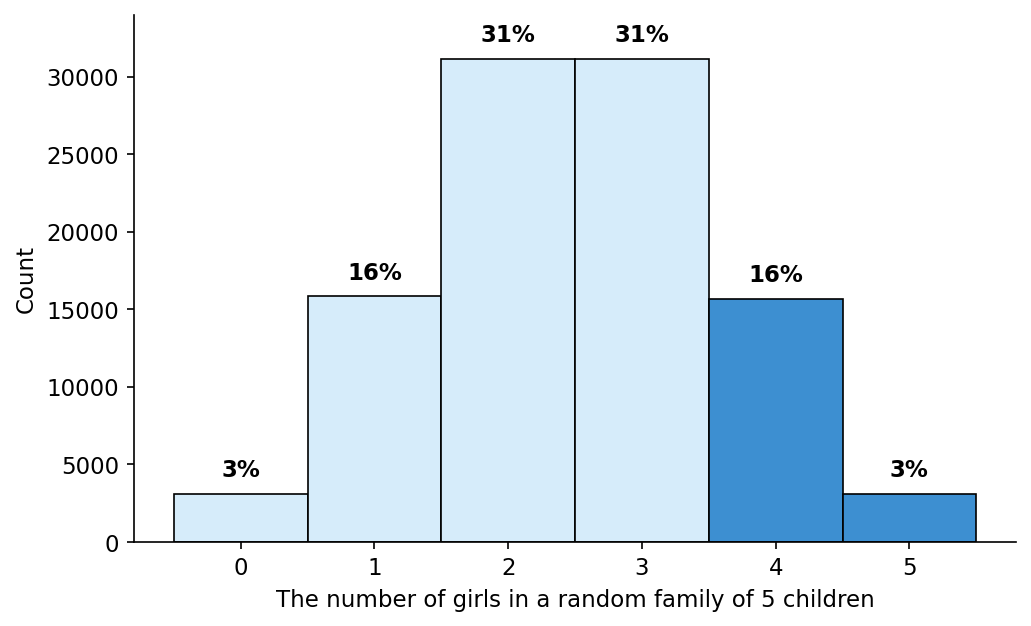
Figure 3.4 Histogram showing the distribution of the number of girls in 100,000 simulated families with equal probabilities of boys and girls.
Figure 3.4 — Null distribution for a family of 5 children
%matplotlib inline
import numpy as np
import matplotlib.pyplot as plt

plt.rcParams.update({'font.size': 11})
def despine(ax):
    ax.spines['top'].set_visible(False)
    ax.spines['right'].set_visible(False)

LIGHT_BLUE = '#d6ecfa'
DARK_BLUE = '#3d8fd1'

np.random.seed(0)
n_children = 5
n_families = 100_000
p_null = 0.5   # fair coin: P(girl) = 0.5 under H0

girls_per_family = np.random.binomial(n_children, p_null, n_families)
counts = np.bincount(girls_per_family, minlength=n_children + 1)
pct = counts / n_families * 100

highlight_from = 4   # families with 4 or 5 girls are shaded darker

fig, ax = plt.subplots(figsize=(7, 4.3))
xs = np.arange(n_children + 1)
colors = [DARK_BLUE if x >= highlight_from else LIGHT_BLUE for x in xs]
ax.bar(xs, counts, width=1, color=colors, edgecolor='black', linewidth=0.8)

for x, c, p in zip(xs, counts, pct):
    ax.text(x, c + n_families * 0.008, f'{p:.0f}%', ha='center', va='bottom', fontweight='bold')

ax.set_xticks(xs)
ax.set_xlabel('The number of girls in a random family of 5 children')
ax.set_ylabel('Count')
ax.set_ylim(0, n_families * 0.34)
despine(ax)

plt.tight_layout()
plt.savefig('null_distribution_5children.png', dpi=150, bbox_inches='tight')
plt.show()